Cleaning Management Solutions
Our solution helps you manage cleanliness on a daily basis to achieve your goals in terms of quality of service, efficient use of resources and sustainability.
This solution is provided as a service — you do not need to acquire equipment or provide your own IT infrastructure. We ensure the systems run correctly and make the data available to you via a web interface.
Our coaches can support you in achieving measurable results according to your objectives.
measure. manage. optimise.

Objective and precise mapping (monitoring) of the cleanliness level (Clean City Index). Measurement of types and quantities of urban waste in real time — the smallest waste detected is a cigarette butt.
Methodology to identify and implement levers for action from the cleanliness diagnostic, in order to achieve significant and measurable results.
Data management for integration into Smart City approaches.
Support for your Cleaning Management Solutions project
Our method enables measurable and sustainable progress in managing the cleanliness of the city. Based on objectives (KPIs), a diagnostic is established to prioritise the levers for action to engage.
Our coaches support your teams in implementing this method and achieving the results.
Get in touchIn our Clean City Labs, we experiment with improvement approaches with teams in the field. This collaboration with our partners and clients provides tools for optimising cleaning services based on objective data.
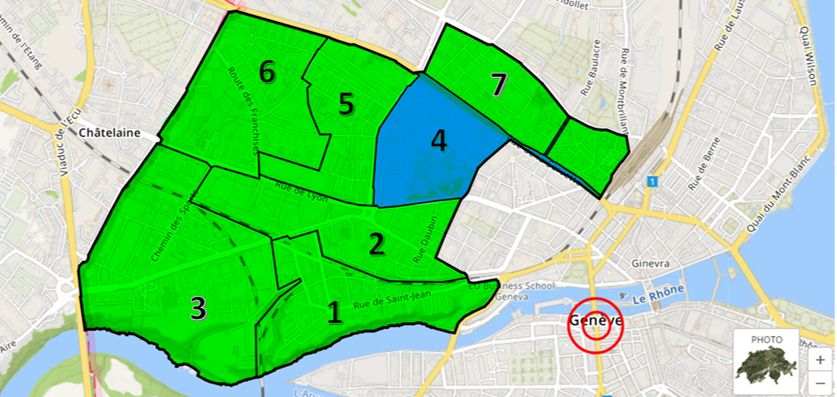
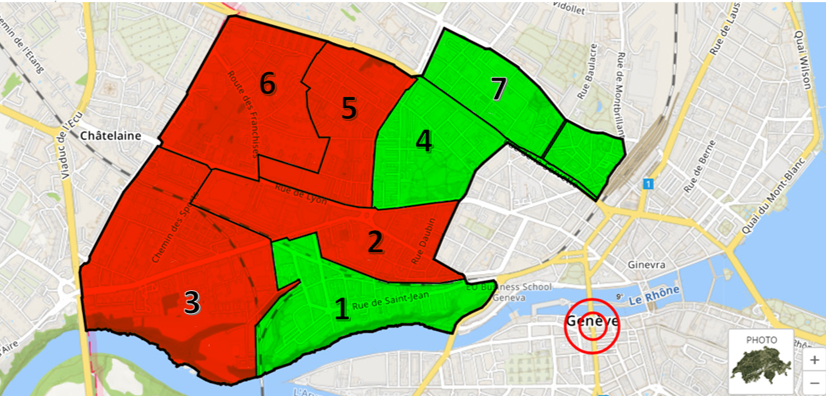
Discover our Clean City Labs →The city defines a target cleanliness level it wants to guarantee — for example, a Clean City Index between 3.0 and 3.5. The cleanliness index is shown on the map using a colour system that enables resources to be deployed where they are needed:
A predominantly green map means quality of service is under control and machines and staff are being used efficiently.
Concrete examples of optimisation with our clients
Analysis of the types of waste that harm the cleanliness index enables targeted measures to be put in place. After measuring that the cleanliness level is impacted at weekends by bottles and cans, this small tourist town introduced targeted manual collection of this waste at critical locations.
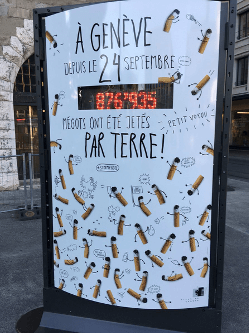
With its "Little Rogue" campaign, the city of Geneva broke new ground to tackle cigarette butt littering. Using monitoring, it identified the most affected locations, pinpointed the root causes (insufficient ashtrays, inappropriate behaviour), then acted precisely on each source. This pioneering approach earned it the AVPU Grand Prix d'honneur.
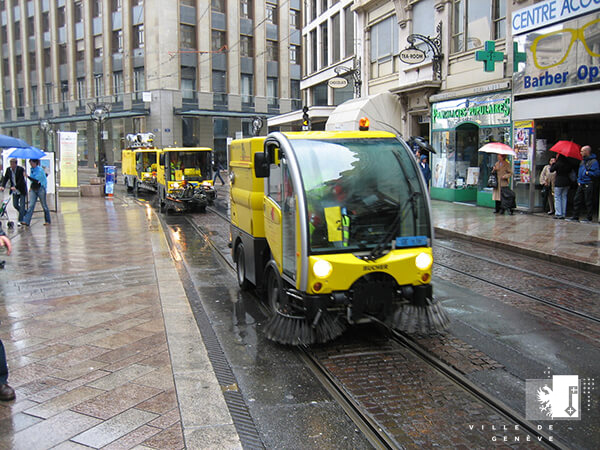
In one of Geneva's road districts, the frequency of street sweeper passes was reduced in a "blue" neighbourhood (cleanliness measured above the target level) in order to increase it in a "red" neighbourhood. The result met expectations: the district's cleanliness level improved without increasing resources.
Find out how Cortexia can transform cleanliness management in your city.
Get in touch